Describing Graphs (The Basics)
This lesson shows how to label and describe a graph using a variety of language (increase, grow, fall, plummet, fluctuate, etc..). It focuses on adjective and verb collocations for natural precise descriptions and also includes a range of practice activities to improve graphical analysis.
Pay-per-Download
Describing Graphs – The Basics [updated 2023]
This lesson begins by labelling the key features of a graph and naming different graph / chart types. It then provides practice in describing a range of different lines (peak, plummet, etc..). This is followed by a fun activity where in pairs students describe and plot the lines on four graphs. Example. Level: ***** [B2/C1] TEACHER MEMBERSHIP / INSTITUTIONAL MEMBERSHIP
*
Describing Graphs (the basics) Video
A short video on the describing graphs lesson
Video Worksheet – click here
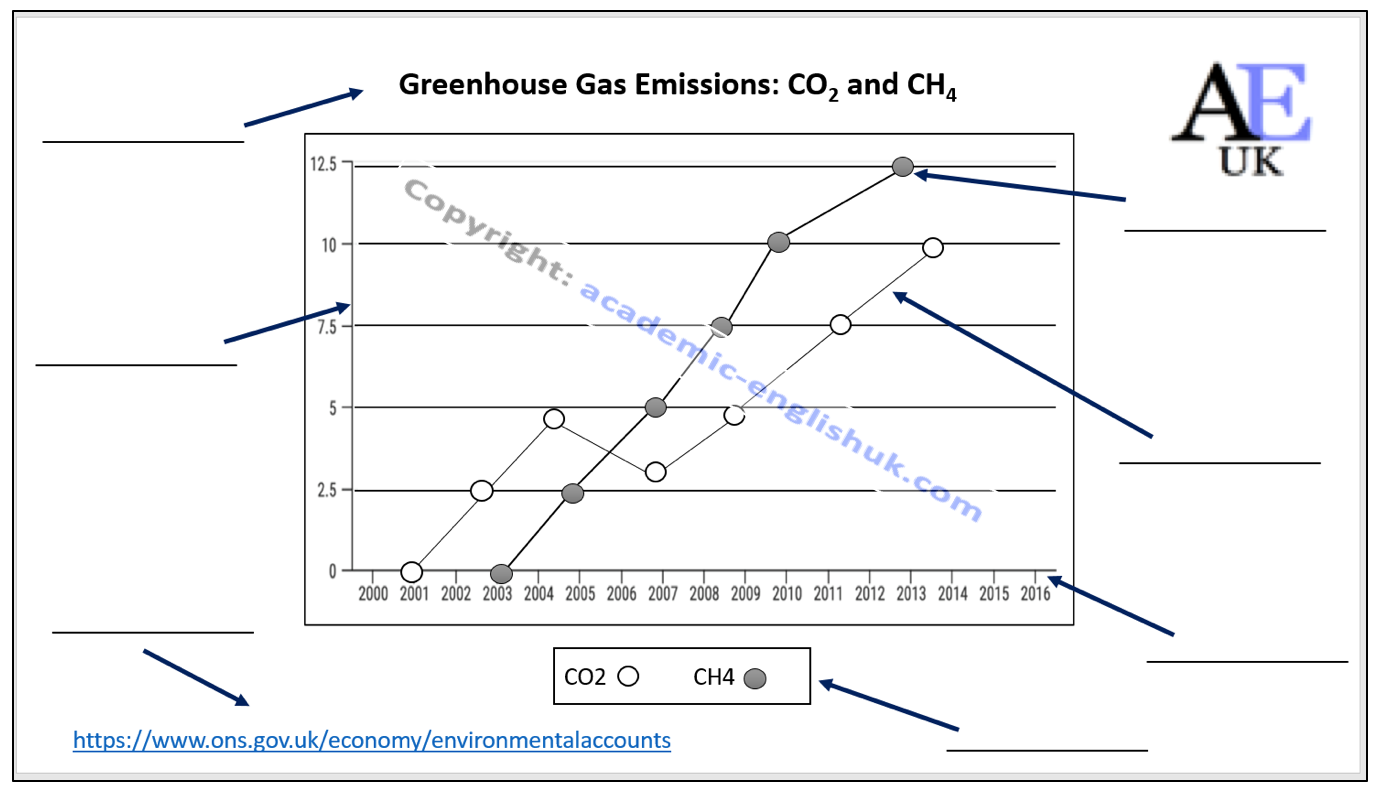
The basic features of a graph
Different graph / chart types

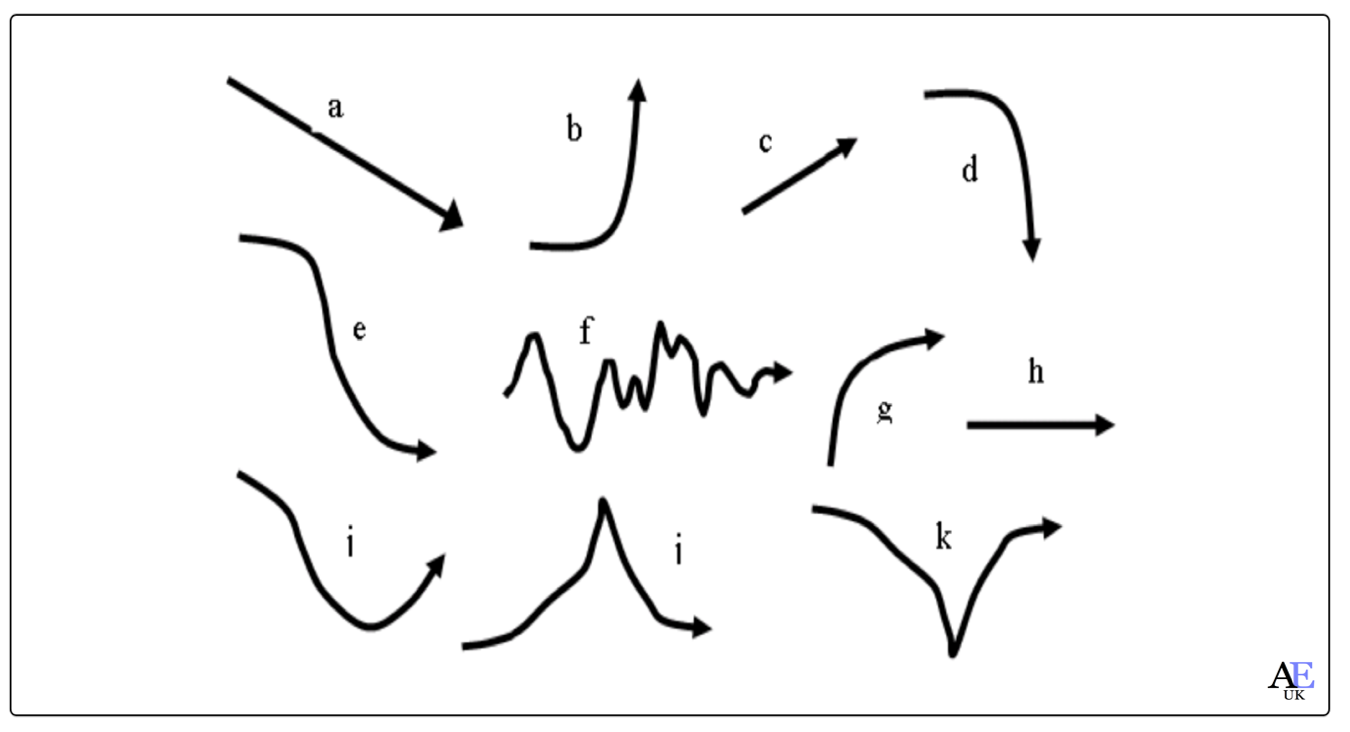
Describing language of a graph
Useful Graph Vocabulary
UP: increase / rise / grow / went up / soar / double / multiply / climb / exceed
DOWN: decrease / drop / fall / decline / plummet / halve / depreciate / plunge
UP & DOWN: fluctuate / undulated / dip
SAME: stable (stabilised) / levelled off / remained constant or steady / consistent
CHANGES: gently / gradually / slightly / steadily / a little
CHANGES: suddenly / sharply / dramatically / steeply / sudden
TOP: reached a peak / peaked / reached its highest level
BOTTOM: bottomed out / sank to a trough / the lowest level
Graphical Collocation
Verbs, adjectives and adjectives that naturally go together.
 AEUK")
 AEUK")
Practice Exercises:
Exercise 1: Definitions of language
Choose a suitable word from the language review – the number of letters of the word are given:
- To reach the highest point of development: P _ _ _
- To rise very quickly at a high level: S _ _ _
- To be firmly fixed or not likely to move or change: _ _ _ _ _ _
- To have a continuous up and down shape or movement: _ _ _ _ _ _ _ _ _
- To reach the highest point of development: peak
- To rise very quickly at a high level: soar
- To be firmly fixed or not likely to move or change: stable
- To have a continuous up and down shape or movement: fluctuate
More exercises in the paying download ‘Describing graphs (the basics)’
Exercise 2: Sentence 3-word choice
Choose one of the words (only one is correct)
- Energy price shares soared / dipped / stablilised in the first three months of the year at 0.56 but have since recovered to 0.58.
- The podcast’s audience has plunged / peaked / soared from 5,000 to 80,000 listeners in 1 week.
- The oil company’s share price fluctuated / plummeted / grew from 27% to 11% in two hours.
More exercises in the paying download ‘Describing graphs (the basics)’
Exercise 3: Sentence gap fill
Choose a suitable word for the gap.
- High growth within the economy for 2023 shows that the unemployment rate is remaining extremely _______________ at 2.9%.
- Vegetable prices tend to _______________ between seasons with higher prices between Nov and March.
- House prices _______________ in 2022 with an average price of £250,000 and now seem to be _______________at this price after the steep rises over the last few years.
- High growth within the economy for 2023 shows that the unemployment rate is remaining extremely stable / constant / consistent at 2.9%.
- Vegetable prices tend to fluctuate / rise and fall between seasons with higher prices between Nov and March.
- House prices peaked / reached a peak / reached its highest level in 2022 with an average price of £250,000 and now seem to be levelling off / stablishing / remaining constant at this price after the steep rises over the last few years.
More exercises in the paying download ‘Describing graphs (the basics)’
Exercise 4: Writing
Write a description of this graph.
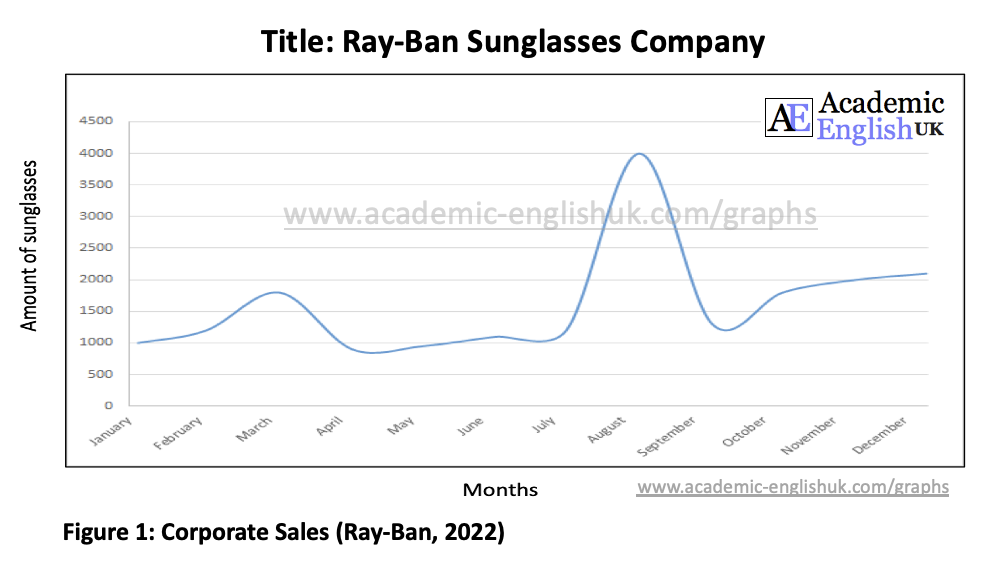
The graph shows Ray-Ban sunglasses sales over 12 months in 2022. Sales began at the start of the year at 1000 and grew steadily to around 1800 in March. Sales then gradually fell to hit their lowest level of the year in April at around 900 pairs sold. Sales stabilised at approximately 1000 throughout May to July. However, in mid-July sales soared and in August peaked at 4000. Sales then plummeted and bottomed out in September at 1250. Sales then rose steadily, and the year finished at 2000 sales.
More exercises in the paying download ‘Describing graphs (the basics)’
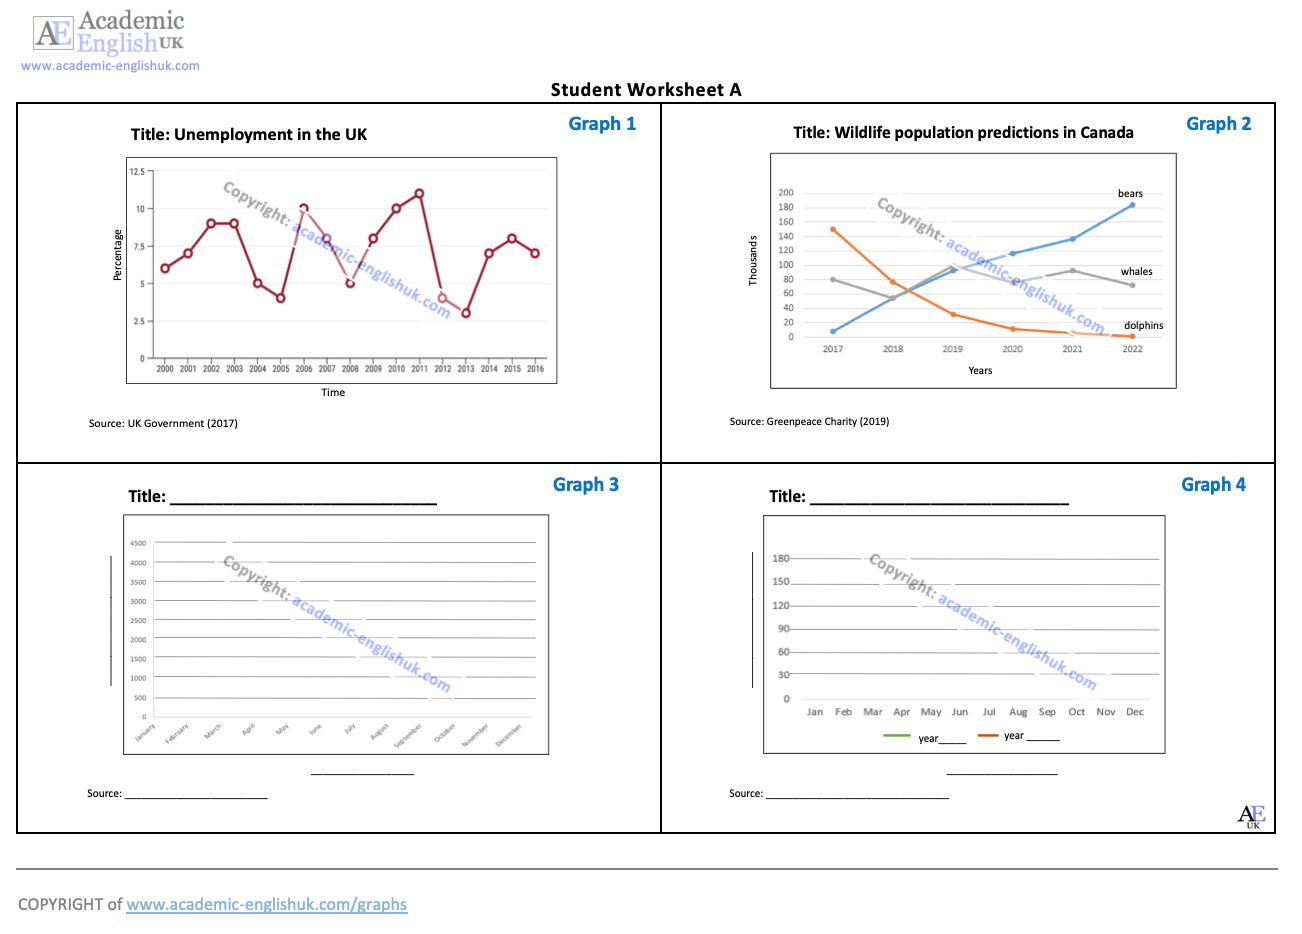
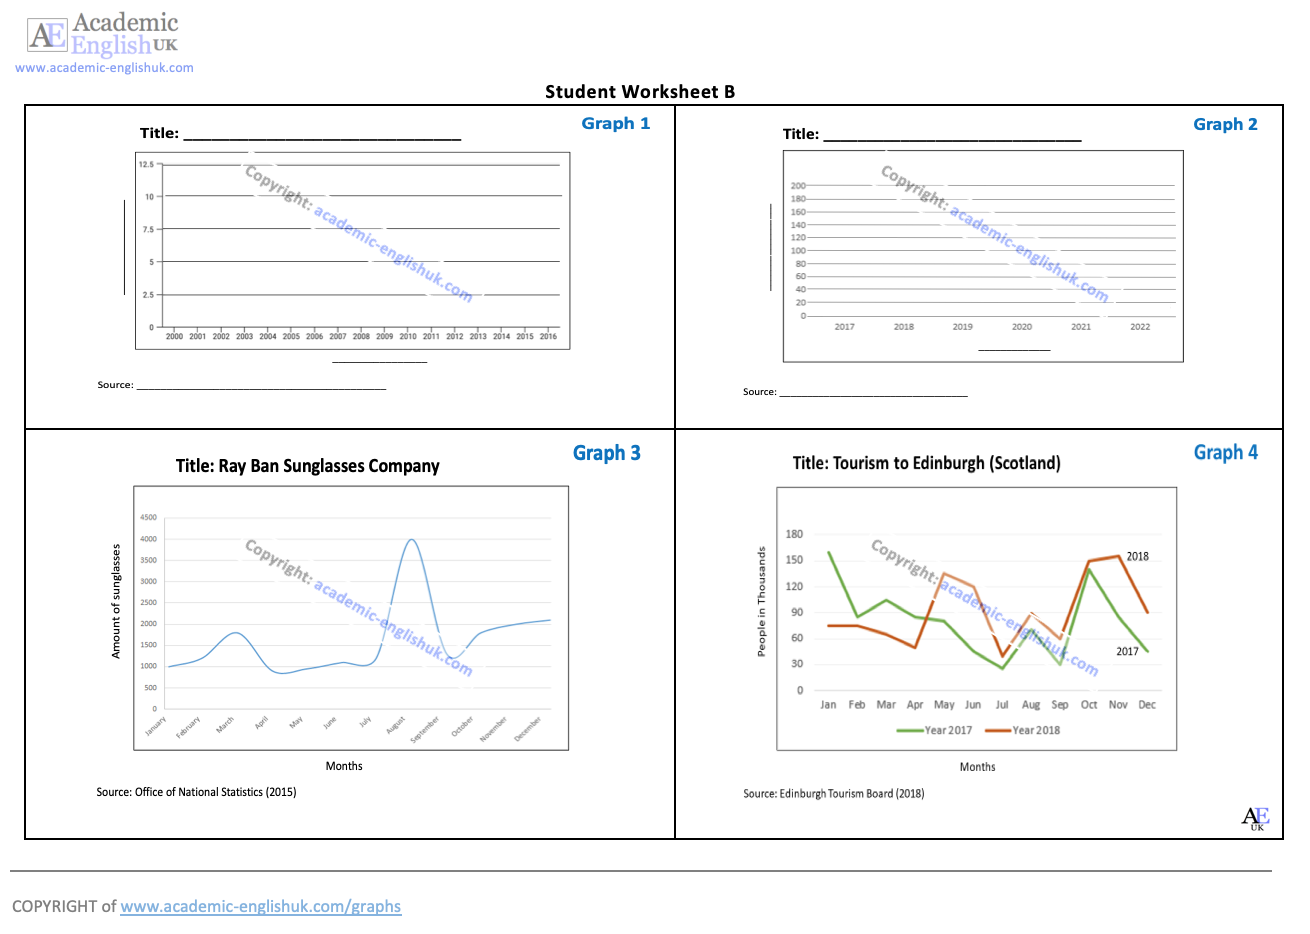
Speaking: Pair Work activity – describe a graph
Pay-per-Download
Describing graphs – the basics [updated 2023]
This lesson begins by labelling the key features of a graph and naming different graph / chart types. It then provides practice in describing a range of different lines (peak, plummet, etc..). This is followed by a fun activity where in pairs students describe and plot the lines on four graphs. Example. Level: ***** [B2/C1] TEACHER MEMBERSHIP / INSTITUTIONAL MEMBERSHIP
*
Other graphical data lessons
Describing graphs: analysis and evaluation (updated 2023)
This lesson begins with describing basic graphs and suggesting what they could represent. It then provides the language necessary for describing, analysing and evaluating. This is followed by students researching and analysing graphs/charts/tables from the Office of National Statistics (ONS) and giving a short presentation on their findings. Example. Level: ***** [B1/B2/C1] TEACHER MEMBERSHIP / INSTITUTIONAL MEMBERSHIP
Academic description, analysis & evaluation [new 2021]
This lesson helps to improve students’ awareness and understanding of the difference between description, analysis and evaluation. It includes paragraph analysis, a detailed language review reference sheet and graph and sentence level quotation analysis. – see worksheet example. Time: 120mins. Level ***** [[B2/C1] TEACHER MEMBERSHIP / INSTITUTIONAL MEMBERSHIP
 Describing Results (questionnaire data) [new 2023]
This lesson teaches students how to describe the results from a questionnaire. It provides language for describing quantities, group sizes, specific features and reporting verbs. It includes model answers and a range of practice activities. Example Level: ***** [B1/B2/C1] TEACHER MEMBERSHIP / INSTITUTIONAL MEMBERSHIP