Graphs & Charts
Describing, analysing, and evaluating graphs is essential at university because it enables students to interpret and communicate quantitative information accurately, not just label features but also identify key trends and patterns in data. This skill helps learners explain what the data shows, why the trends occur, and what implications the evidence may have in an academic context, which are higher-order analytical skills valued in research and assessment. Being able to work effectively with graphs supports critical thinking, strengthens arguments in writing and presentations, and allows students to engage confidently with data-rich academic texts and research findings (AEUK, 2026).
RESOURCES: Reading / Writing / Listening / Speaking / Argument / SPSE / Reports / Process Writing / Reading Tests / Summary / Grammar / Vocab / Critical Thinking / Instant Lessons / Medical English / English for Art / A.I Lessons / Graphs & Charts / New 2026 /

Graph and Chart Lessons
Describing Graphs – The Basics [updated 2023]
This lesson begins by labelling the key features of a graph and naming different graph / chart types. It then provides practice in describing a range of different lines (peak, plummet, etc..). This is followed by a fun activity where in pairs students describe and plot the lines on four graphs. Example. Level: ***** [B2/C1] TEACHER MEMBERSHIP / INSTITUTIONAL MEMBERSHIP
*
Describing graphs: analysis and evaluation (updated 2023)
This lesson begins with describing basic graphs and suggesting what they could represent. It then provides the language necessary for describing, analysing and evaluating. This is followed by students researching and analysing graphs/charts/tables from the Office of National Statistics (ONS) and giving a short presentation on their findings. Example. Level: ***** [B1/B2/C1] TEACHER MEMBERSHIP / INSTITUTIONAL MEMBERSHIP
 Describing Results (questionnaire data) [new 2023]
This lesson teaches students how to describe the results from a questionnaire. It provides language for describing quantities, group sizes, specific features and reporting verbs. It includes model answers and a range of practice activities. Example Level: ***** [B1/B2/C1] TEACHER MEMBERSHIP / INSTITUTIONAL MEMBERSHIP
Academic description, analysis & evaluation [new 2021]
This lesson helps to improve students’ awareness and understanding of the difference between description, analysis and evaluation. It includes paragraph analysis, a detailed language review reference sheet and graph and sentence level quotation analysis. – see worksheet example. Time: 120mins. Level ***** [[B2/C1] TEACHER MEMBERSHIP / INSTITUTIONAL MEMBERSHIP
Describing Graphs: The basics
This lesson shows how to label and describe a graph using a variety of language (increase, grow, fall, plummet, fluctuate, etc..). It focuses on adjective and verb collocations for natural precise descriptions and also includes a range of practice activities to improve graphical analysis.
Video
A short video on the describing graphs lesson
If you can’t access this YouTube video in your country, go here
Video Worksheet – click here
The basic features of a graph
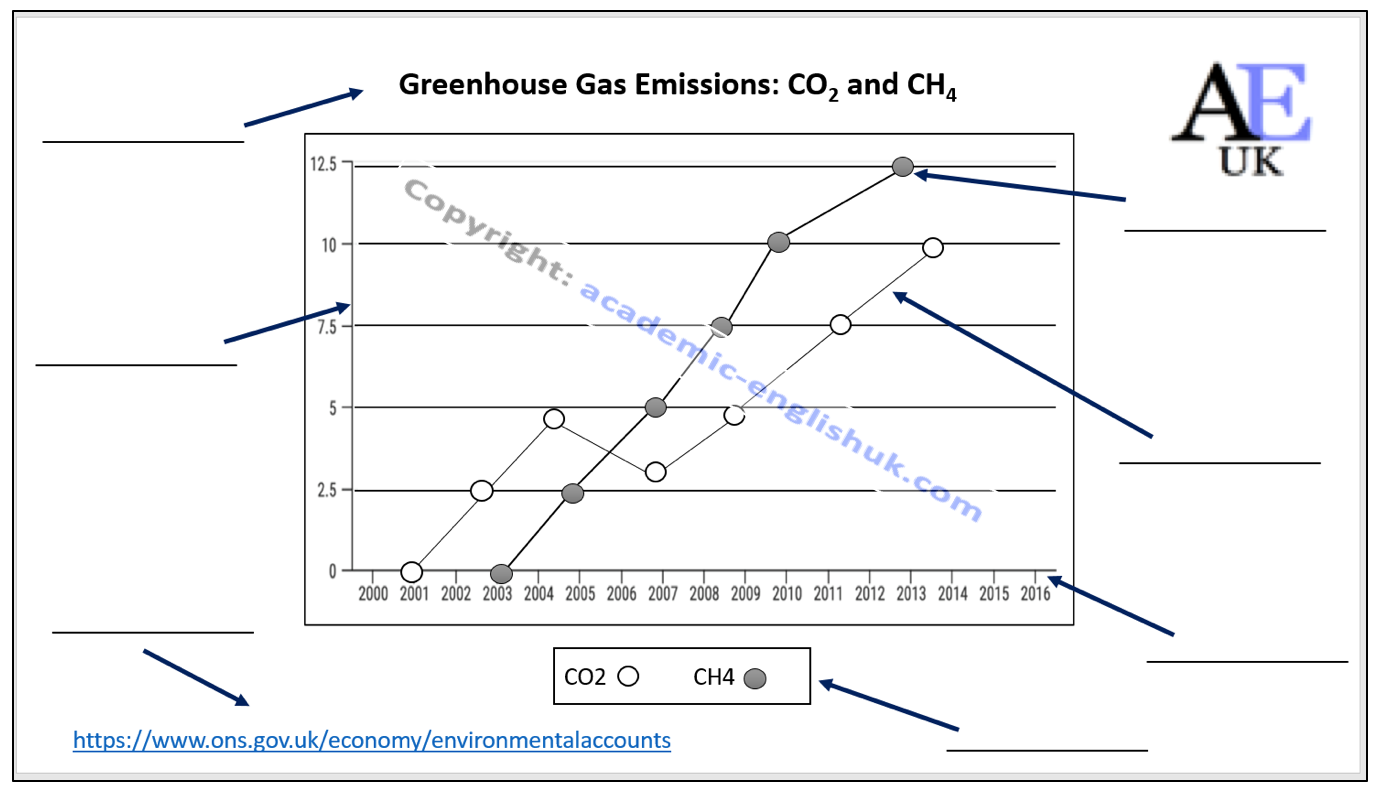
Different graph / chart types

Describing language of a graph
Useful Graph Vocabulary
UP: increase / rise / grow / went up / soar / double / multiply / climb / exceed
DOWN: decrease / drop / fall / decline / plummet / halve / depreciate / plunge
UP & DOWN: fluctuate / undulated / dip
SAME: stable (stabilised) / levelled off / remained constant or steady / consistent
CHANGES: gently / gradually / slightly / steadily / a little
CHANGES: suddenly / sharply / dramatically / steeply / sudden
TOP: reached a peak / peaked / reached its highest level
BOTTOM: bottomed out / sank to a trough / the lowest level
Graphical Collocation
Verbs, adjectives and adjectives that naturally go together.
 AEUK")
 AEUK")
Example: Writing
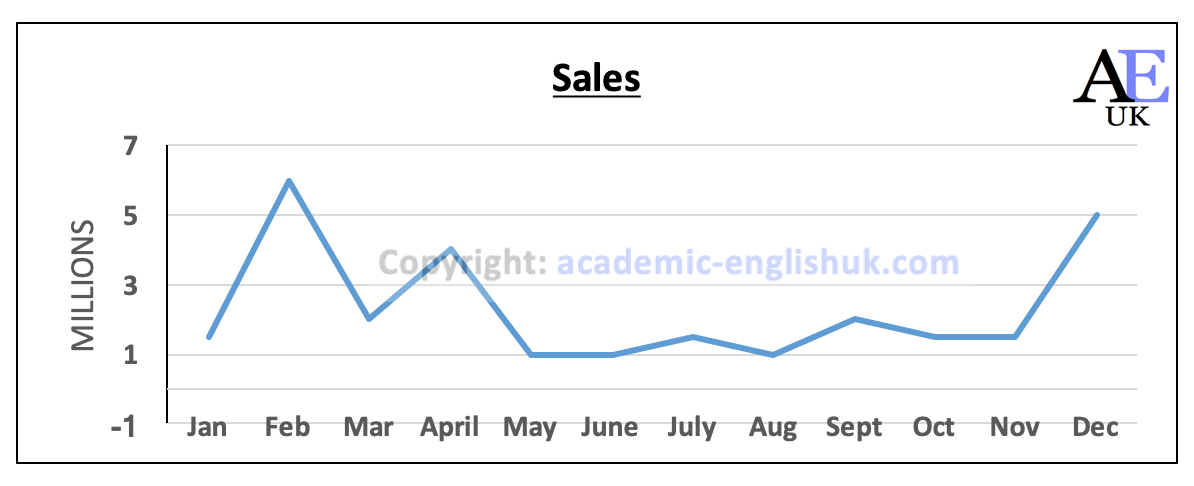
Write a description of this graph.
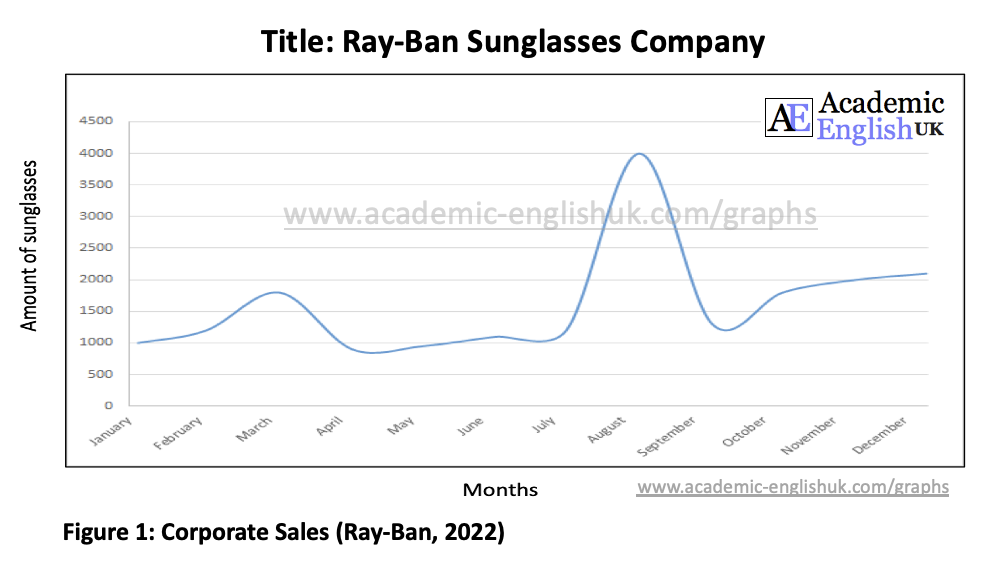
The graph shows Ray-Ban sunglasses sales over 12 months in 2022. Sales began at the start of the year at 1000 and grew steadily to around 1800 in March. Sales then gradually fell to hit their lowest level of the year in April at around 900 pairs sold. Sales stabilised at approximately 1000 throughout May to July. However, in mid-July sales soared and in August peaked at 4000. Sales then plummeted and bottomed out in September at 1250. Sales then rose steadily, and the year finished at 2000 sales.
More exercises in the paying download ‘Describing graphs (the basics)’
Speaking: Pair Work activity – describe a graph
Pay-per-Download
Describing graphs – the basics [updated 2023]
This lesson begins by labelling the key features of a graph and naming different graph / chart types. It then provides practice in describing a range of different lines (peak, plummet, etc..). This is followed by a fun activity where in pairs students describe and plot the lines on four graphs. Example. Level: ***** [B2/C1] TEACHER MEMBERSHIP / INSTITUTIONAL MEMBERSHIP
*
Describing Graphs: Analysis and evaluation
This lesson shows how analyse and evaluate a graph using a variety of language phrases. It focuses on a set procedure of graphical description, analysis and evaluation. There are good clear examples and lots of exercises.
Video
A short video on the describing graphs analysis and evaluation lesson
If you can’t access this YouTube video in your country, go here
Video Worksheet – click here
Basic definition of analysis & evaluation
i. Analysis is ‘identifying’ the key highs and lows on a graph
ii. Evaluation is ‘the reasons’ why there are highs and lows on a graph.
Line graph
1. Describe this graph (analysis) and then suggest the reasons for these trends (evaluation)
Bar Chart
2.Describe this chart (analysis) and then suggest the reasons for these trends (evaluation)

Describe these graphs / charts (analysis) and then suggest the reasons for these trends (evaluation)
1. Analysis: Peaks in Feb, April, Dec.
2. Evaluation: Product is flowers (Feb=Valentine’s day / April = Easter / Dec = Christmas).
Other answers are possible with justification.
1. Analysis: Peak sales in June, July, August
2. Evaluation: Ice cream sales
Other answers are possible with justification.
Useful graph language: Description
The graph from (source) presents data on (title)…
The graph from (source) shows/ illustrates (title)…
If we look at this graph on (title) from (source) you can see…
The y axis (vertical) is… and the x axis (horizontal) is…
(Graph) These lines represent… (Bar) These Columns are… (Pie) These segments are… (Table)
Useful graph language: analysis
Overall summary: Overall, there is / has been… / Generally, there is…
What you can see is… / From the graph we can see…
I’d like to focus your attention on…
If you look at this…, you’ll see / notice / understand
A key significant area is … / Two key significant areas are…
An important point is… / Two important points I’d like to illustrate are…
What is interesting here is…
An interesting observation is…
An analysis of the graph illustrates…
Looking at ….
Useful graph language: evaluation
This seems to suggest that…
This is possibly because of…
This is (clearly) due to…
One reason for this could be…
An evaluation of this data suggests / provides evidence for / highlights…
To provide evidence to my previous point the graph highlights…
Overall, this highlights the significance of…
Therefore, this provides evidence that…
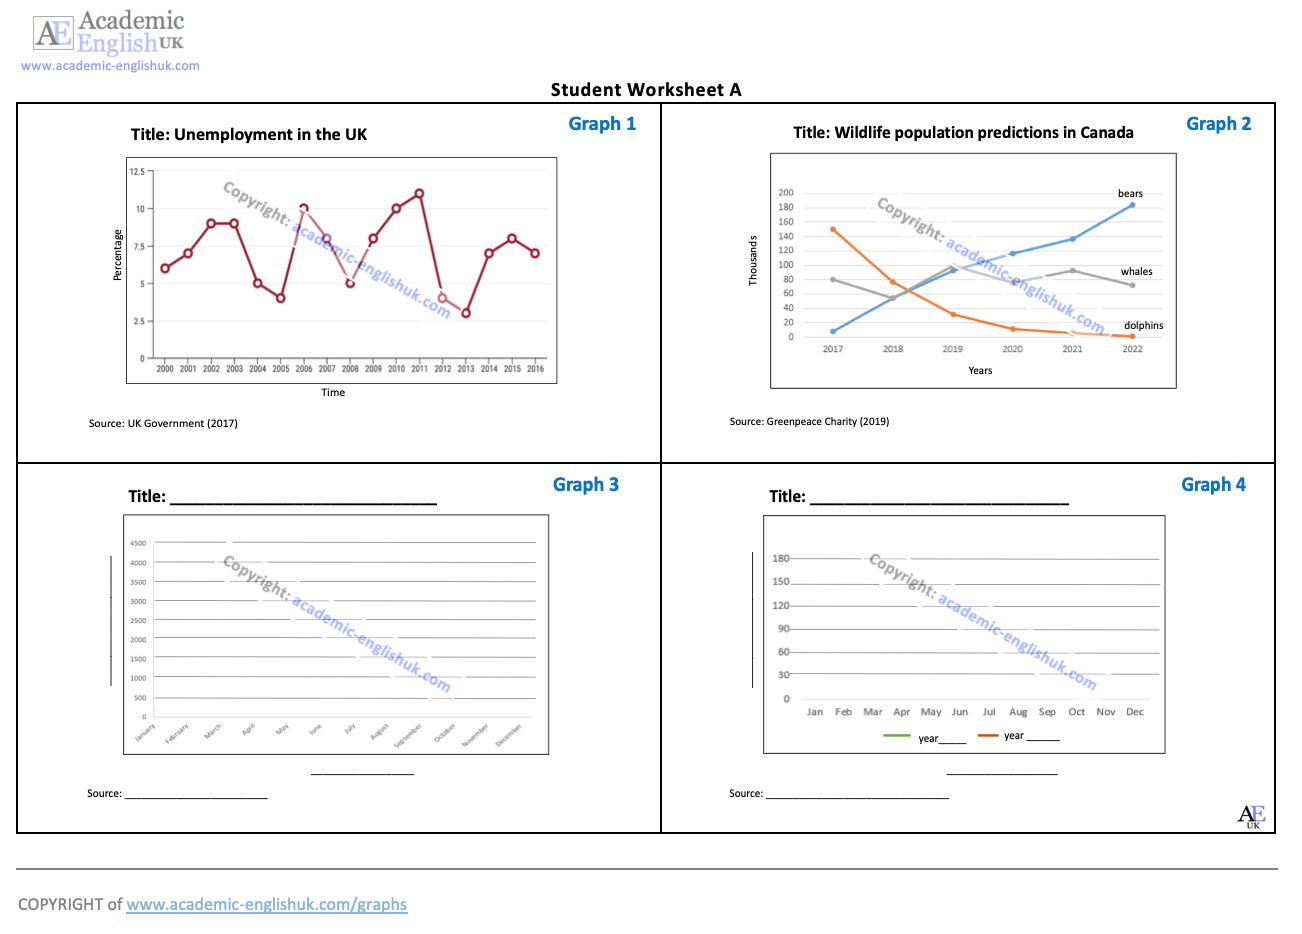
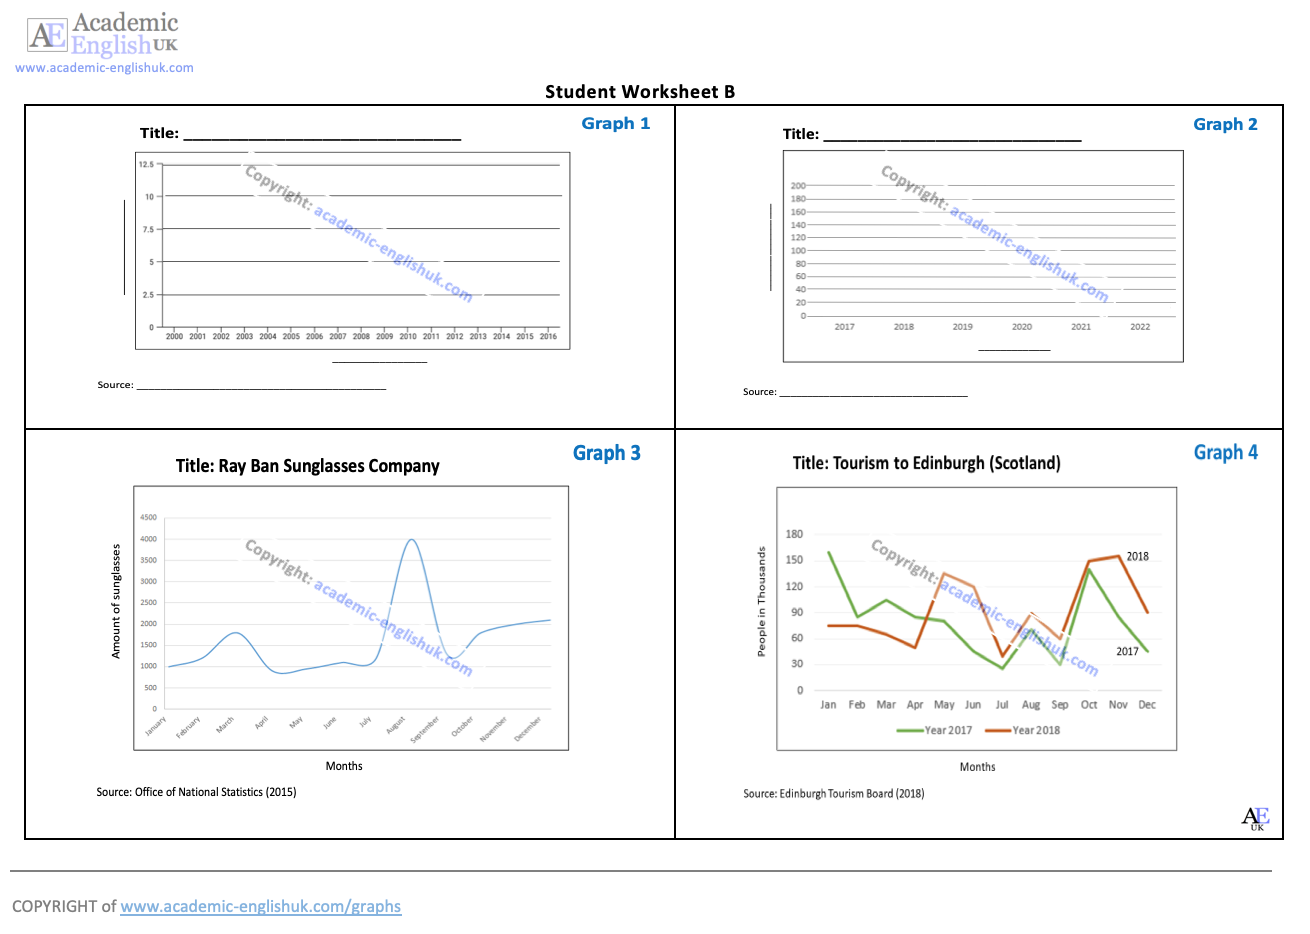
Describing graphs:
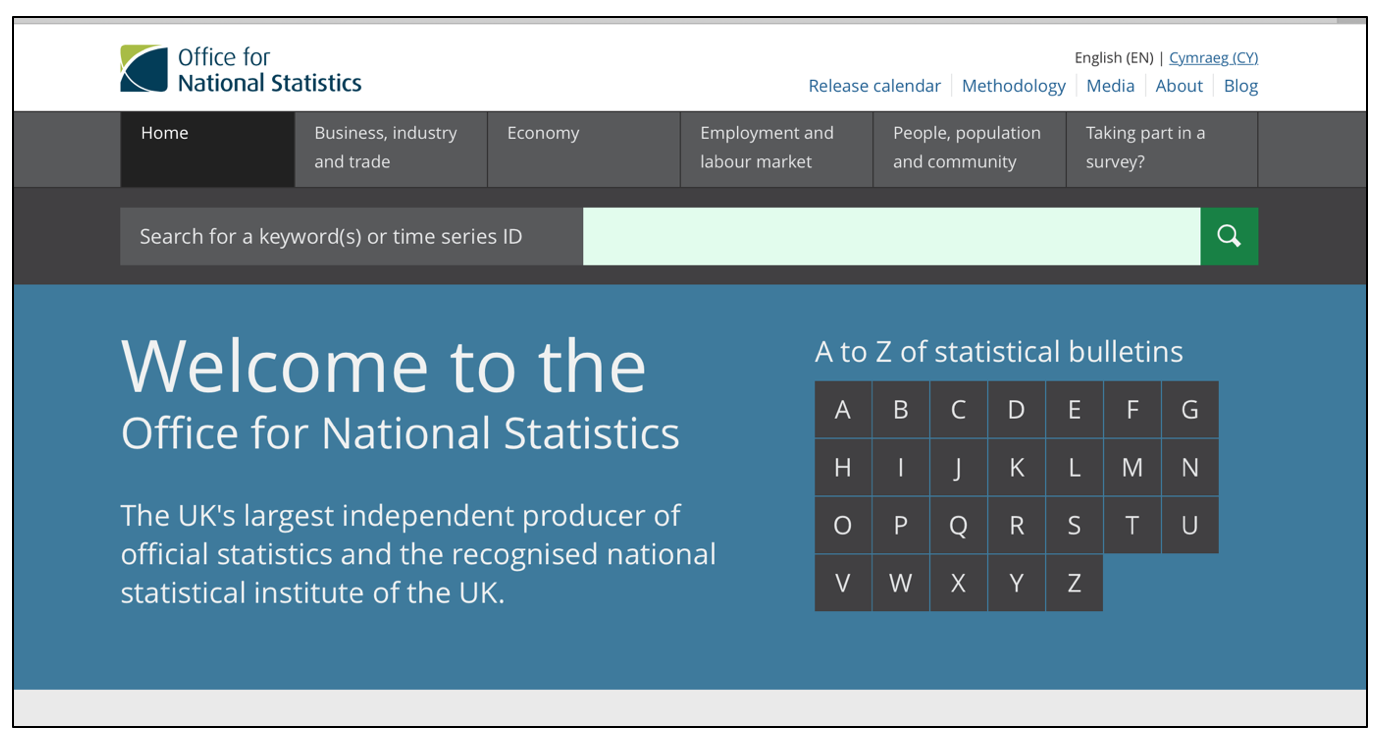
Task: Analyse and evaluate an Office of National Statistics (ONS) graph / chart / table and give a 1-2-minute presentation on your findings.
Guidelines
-
Your teacher will allocate one of the graphs / charts / tables below.
-
Open the specific ONS webpage link and find the specific section and graph / chart / table.
-
Analyse and evaluate the graph / chart / table using language sheet 1.
-
You must follow the 3 key stages (describe the key elements (labelling), analysis and evaluation).
-
You may need to do some internet research to help your understanding / evaluation.
-
Give a 2-minute presentation of your graph using your own analysis and evaluation.
-
You have 20-minutes preparation time.


18 more different graphs / charts / tables with paid version.
Other topics: life satisfaction / divorce / religion / mental health / alcohol / mobile phones / murder / technology / leisure / population growth / life expectancy / etc..
Pay-per-Download
Describing graphs: analysis and evaluation (updated 2023)
This lesson begins with describing basic graphs and suggesting what they could represent. It then provides the language necessary for describing, analysing and evaluating. This is followed by students researching and analysing graphs/charts/tables from the Office of National Statistics (ONS) and giving a short presentation on their findings. Example. Level: ***** [B1/B2/C1] TEACHER MEMBERSHIP / INSTITUTIONAL MEMBERSHIP
Describing Results: Questionnaires
This webpage provides information on how to describe the results from a questionnaire. It provides language for describing quantities, group sizes, specific features and reporting verbs. It includes model answers and a range of practice activities (bar charts, pies charts and tables).
Video
A short video on the describing results lesson
If you can’t access this YouTube video in your country, go here
Video Worksheet – click here
Describing Results Example
This pie chart has been created from a questionnaire which asked 500 students what the main causes of their mental health issues at university were.

Exercise
Read through these short descriptions of the above data and highlight the reporting verbs and linking words.Then highlight the phrases for describing quantity and adjective collocations. You may need to study the describing results language development below first. Download descriptions here.
- Descriptions
- Reporting verbs & linking words ANSWERS
- Describing quantity and adjective collocations ANSWERS
- The most significant finding from the questionnaire is that approximately a third of respondents (32%) said that loneliness was the main cause of their mental health issue at university. This was in contrast to a small number of students (4%) saying that alcohol was the primary cause.
- Although the majority of students stated that loneliness and stress were the most significant mental health issues at university at 55%, academic performance and money problems were also reported to be fundamental at 28%.
- A small minority of students (4%) contended that their mental health issues were attributed to alcohol abuse, whereas a similar number (5%) declared family issues were the main contributing factor.
- The most significant finding from the questionnaire is that approximately a third of respondents (32%) said that loneliness was the main cause of their mental health issue at university. This was in contrast to a small number of students (4%) saying that alcohol was the primary cause.
- Although the majority of students stated that loneliness and stress were the most significant mental health issues at university at 55%, academic performance and money problems were also reported to be fundamental (issue) at 28%.
- A small minority of students (4%) contended that their mental health issues were attributed to alcohol abuse, whereas a similar number (5%) declared family issues were the main contributing factor.
Describing Results Language Development


 AEUK")
Pay-per-Download
Describing Results (questionnaire data) [new 2023]
This lesson teaches students how to describe the results from a questionnaire. It provides language for describing quantities, group sizes, specific features and reporting verbs. It includes model answers and a range of practice activities. Example Level: ***** [B1/B2/C1] TEACHER MEMBERSHIP / INSTITUTIONAL MEMBERSHIP
Description, analysis and evaluation (writing)
Description: To give a clear and detailed picture of something.
Analysis: To make a methodical and detailed examination.
Evaluation: To make judgements about the value of information.
Video
A short 9-minute video on description, analysis and evaluation in writing.
Video Worksheet Download – go here
PDF Lesson Download
Academic description, analysis & evaluation [new 2021]
This lesson helps to improve students’ awareness and understanding of the difference between description, analysis and evaluation. It includes paragraph analysis, a detailed language review reference sheet and graph and sentence level quotation analysis. – see worksheet example. Time: 120mins. Level ***** [[B2/C1] TEACHER MEMBERSHIP / INSTITUTIONAL MEMBERSHIP
Language Review


Graphs and Charts Downloads
Describing Graphs – The Basics [updated 2023]
This lesson begins by labelling the key features of a graph and naming different graph / chart types. It then provides practice in describing a range of different lines (peak, plummet, etc..). This is followed by a fun activity where in pairs students describe and plot the lines on four graphs. Example. Level: ***** [B2/C1] TEACHER MEMBERSHIP / INSTITUTIONAL MEMBERSHIP
*
Describing graphs: analysis and evaluation (updated 2023)
This lesson begins with describing basic graphs and suggesting what they could represent. It then provides the language necessary for describing, analysing and evaluating. This is followed by students researching and analysing graphs/charts/tables from the Office of National Statistics (ONS) and giving a short presentation on their findings. Example. Level: ***** [B1/B2/C1] TEACHER MEMBERSHIP / INSTITUTIONAL MEMBERSHIP
Describing Results (questionnaire data) [new 2023]
This lesson teaches students how to describe the results from a questionnaire. It provides language for describing quantities, group sizes, specific features and reporting verbs. It includes model answers and a range of practice activities. Example Level: ***** [B1/B2/C1] TEACHER MEMBERSHIP / INSTITUTIONAL MEMBERSHIP
Academic description, analysis & evaluation [new 2021]
This lesson helps to improve students’ awareness and understanding of the difference between description, analysis and evaluation. It includes paragraph analysis, a detailed language review reference sheet and graph and sentence level quotation analysis. – see worksheet example. Time: 120mins. Level ***** [[B2/C1] TEACHER MEMBERSHIP / INSTITUTIONAL MEMBERSHIP
More digital resources and lessons

Writing
online resources
Grammar
online resources

Writing Skills
online resources

AI Lessons
online resources
New for 2026
online resources

Readings
online resources

Vocabulary
online resources

Reports
online resources

Art
online resources

6-Week
Members only

Listening
online resources

Correction
online resources

Argument
online resources

Medical
online resources

OneDrive
Members only

Speaking
online resources

Feedback
online resources

SPSE Essays
online resources

Topic-lessons
online resources

AEUK Blog
online resources

Criticality
online resources

Criteria
online resources
Graphs
online resources

Instants
online resources

Free
online resources