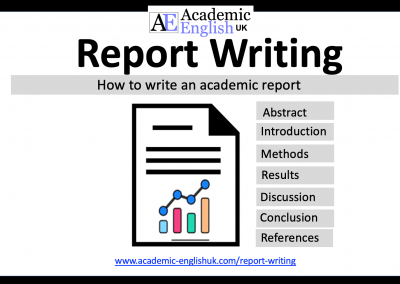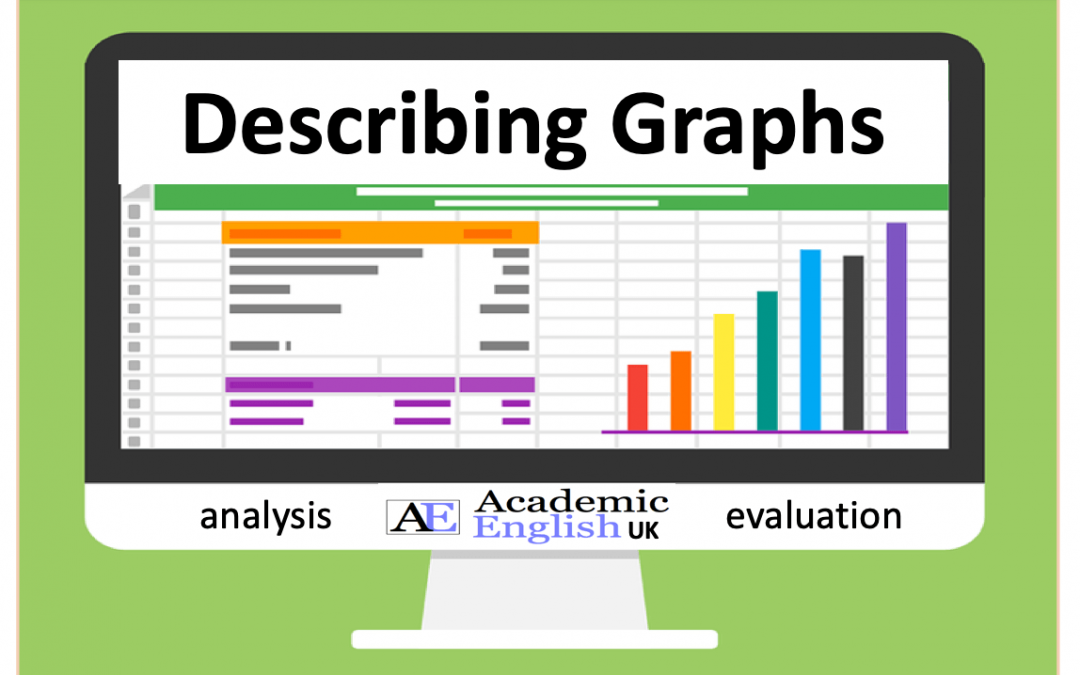
Describing Graphs
This blog offers two great lessons on describing, analysing and evaluating graphs / charts / tables.
The first lesson begins with naming different graph / chart types and describing a range of different lines (peak, plummet, etc..). It finishes with a fun activity where students describe and plot the lines on four graphs.
The second lesson provides the language necessary for describing, analysing and evaluating graphs. It is followed by researching and analysing graphs/charts/tables from the Office of National Statistics (ONS) and giving a short presentation on the findings.
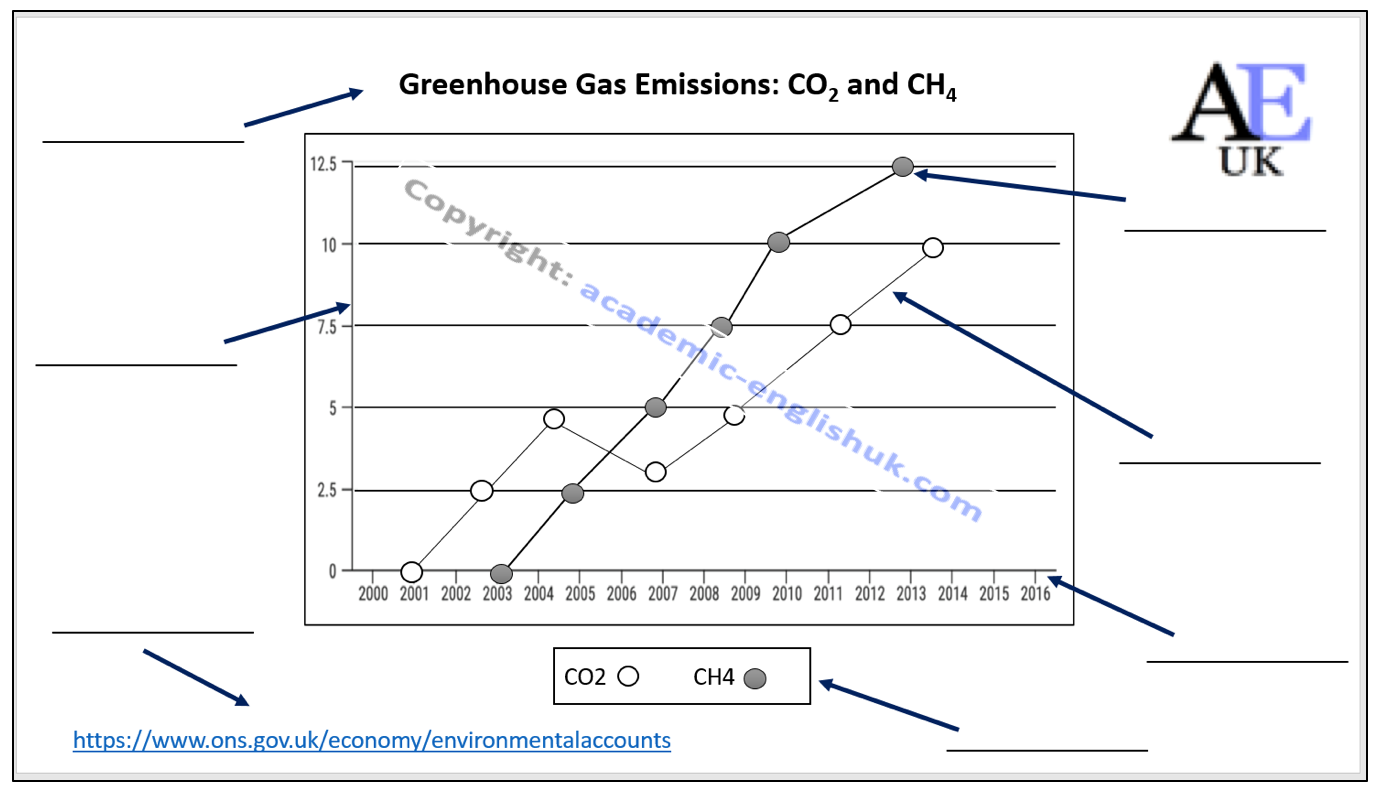
The basic features of a graph
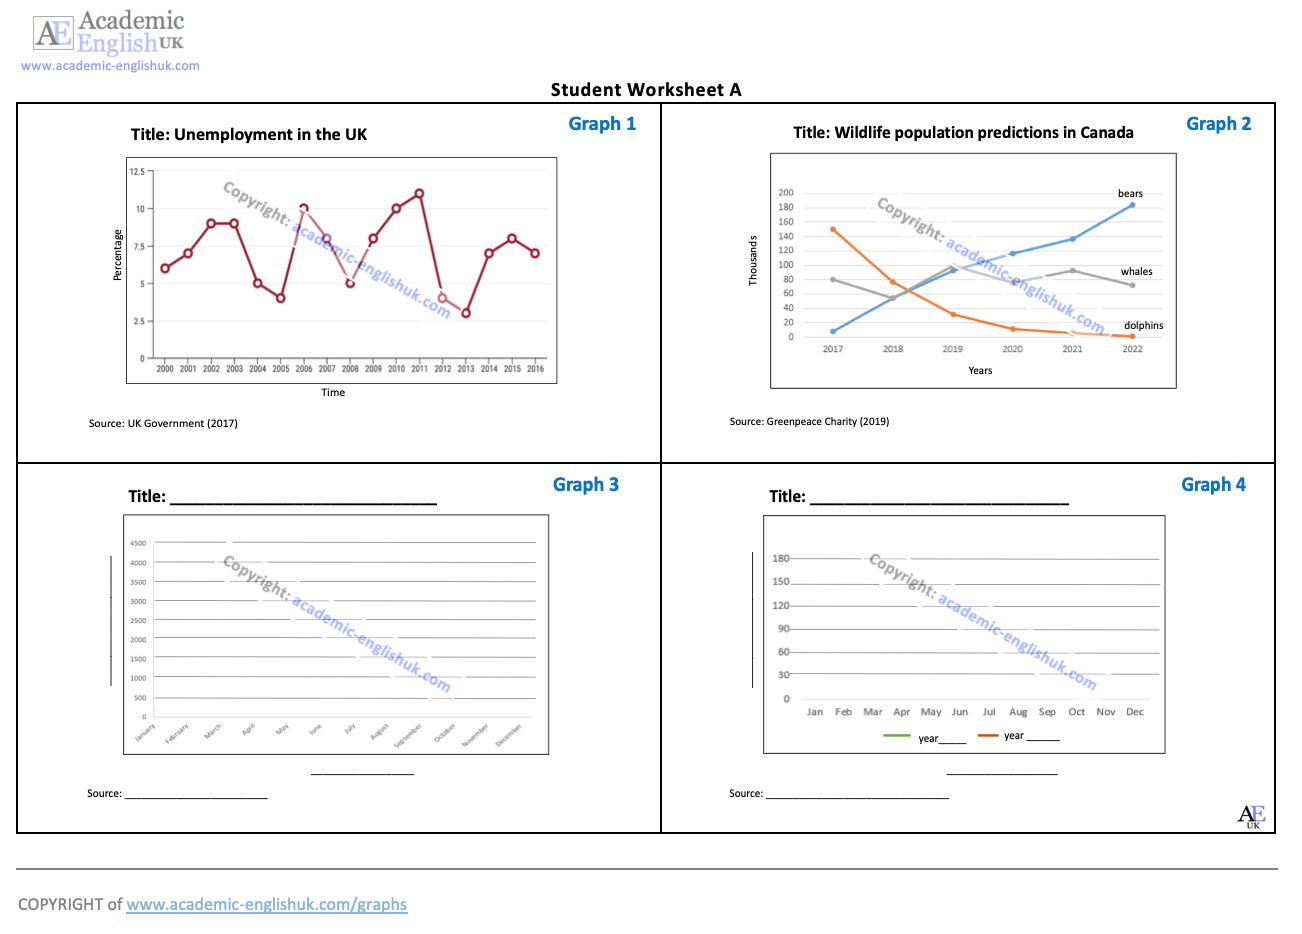
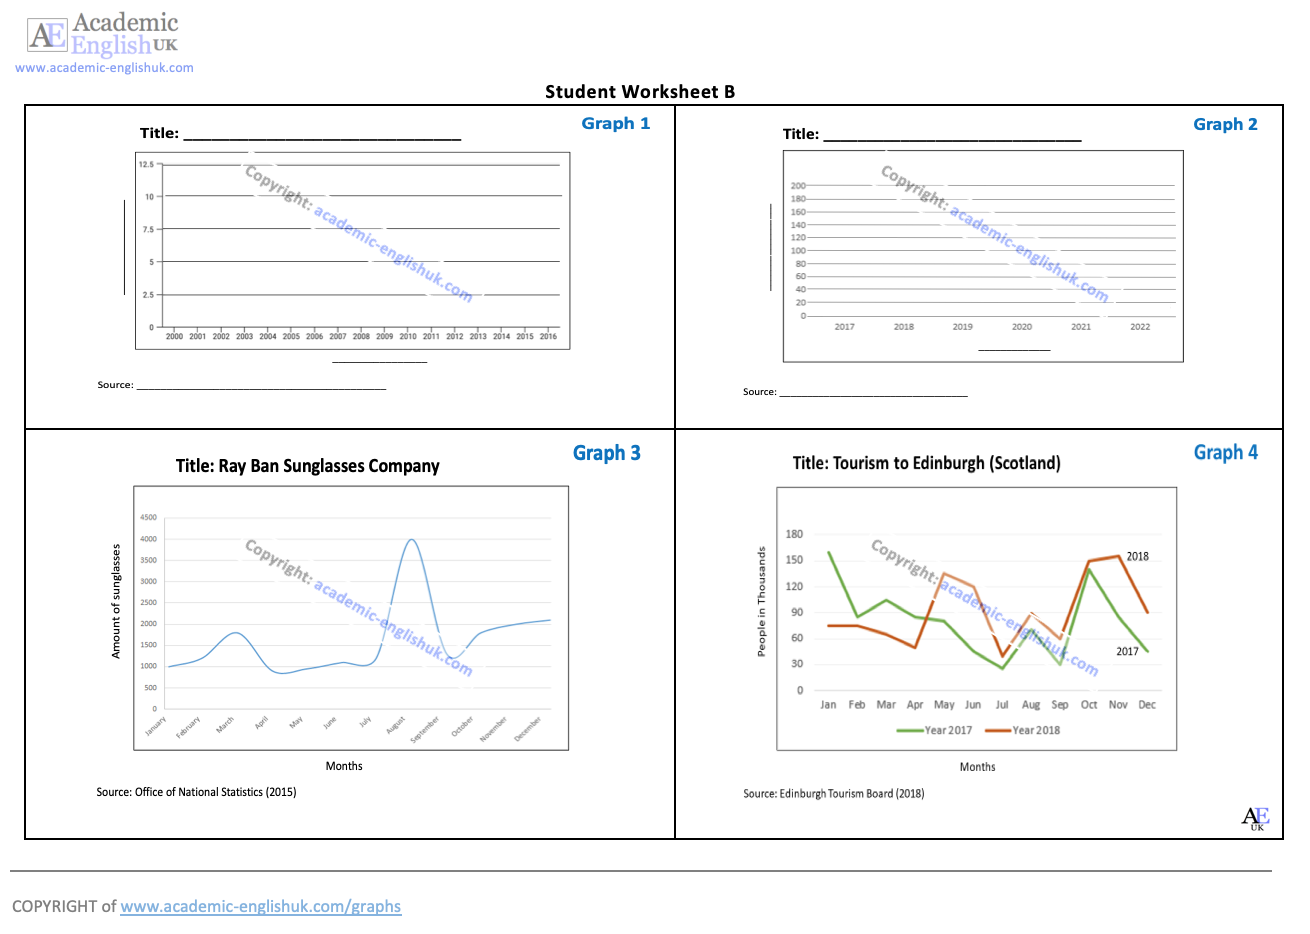
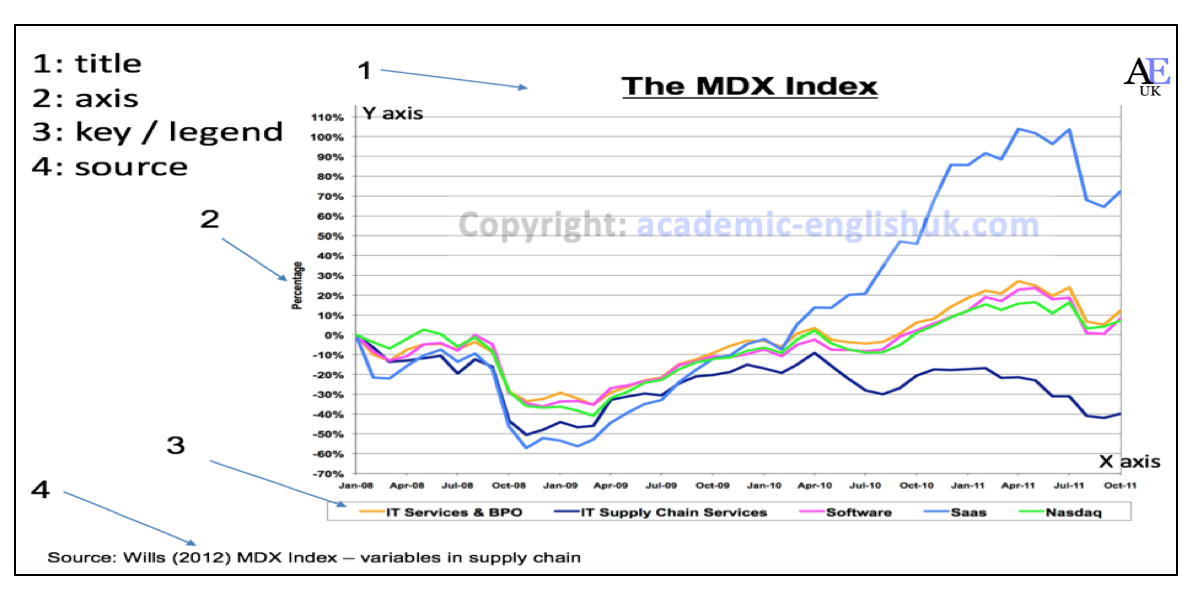
- Label the basic parts on this graph
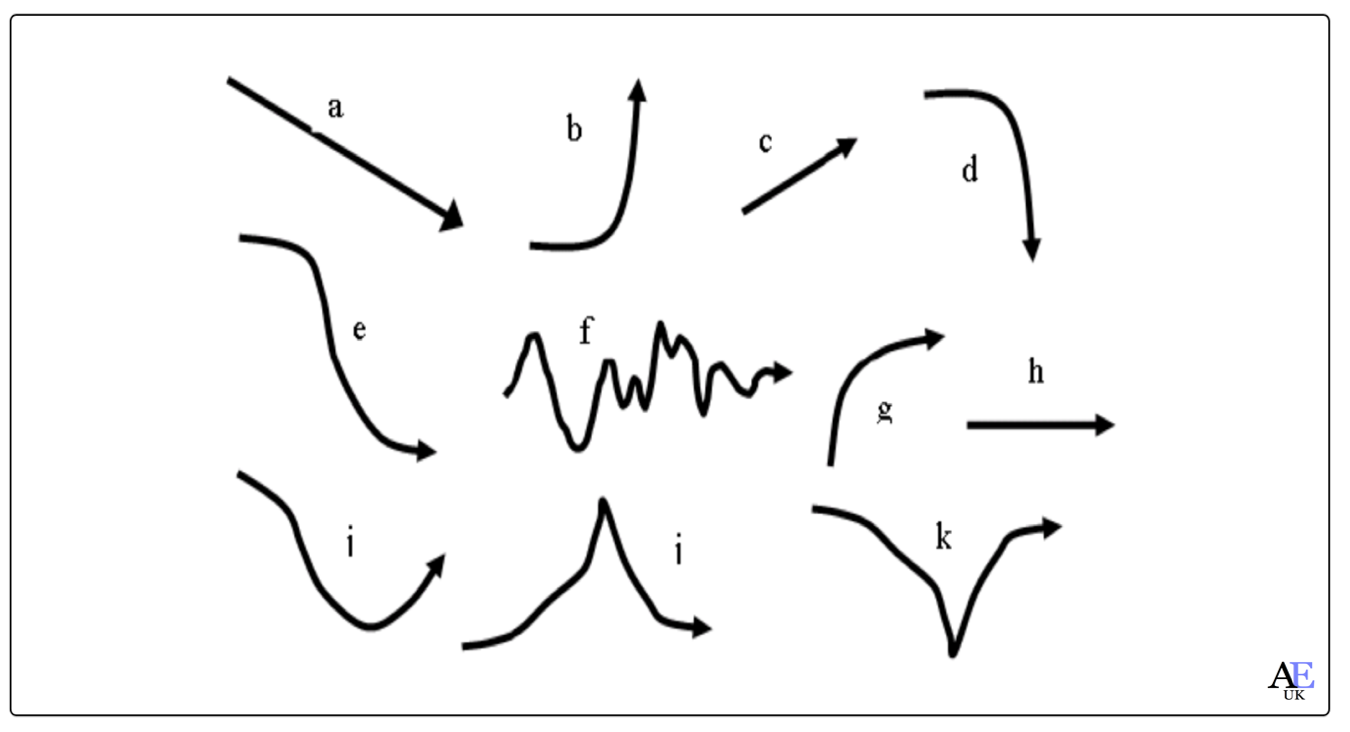
Different graph / chart types
2. Name these different types of graph/charts

Describing language of a graph
3.Name the different types of graphical lines
Adapted from: http://online-resources.elc.cityu.edu.hk
Useful Graph Vocabulary
UP: increase / rise / grow / went up / soar / double / multiply / climb / exceed /
DOWN: decrease / drop / fall / decline / plummet / halve / depreciate / plunge
UP & DOWN: fluctuate / undulated / dip /
SAME: stable (stabilised) / levelled off / remained constant or steady / consistent
CHANGES: gently / gradually / slightly / steadily / a little /
CHANGES: suddenly / sharply / dramatically / steeply / sudden
TOP: reached a peak / peaked / reached its highest level /
BOTTOM: bottomed out / sank to a trough / the lowest level
Speaking: pair work activity – describe a graph
4. Explain the graph to your partner (Do NOT show the graph)
Describing graphs – the basics [updated 2023]
This lesson begins by labelling the key features of a graph and naming different graph / chart types. It then provides practice in describing a range of different lines (peak, plummet, etc..). This is followed by a fun activity where in pairs students describe and plot the lines on four graphs. Example. Level: ***** [B2/C1] TEACHER MEMBERSHIP / INSTITUTIONAL MEMBERSHIP
Describing graphs: analysis and evaluation (updated 2023)
This lesson begins with describing basic graphs and suggesting what they could represent. It then provides the language necessary for describing, analysing and evaluating. This is followed by students researching and analysing graphs/charts/tables from the Office of National Statistics (ONS) and giving a short presentation on their findings. Example. Level: ***** [B1/B2/C1] TEACHER MEMBERSHIP / INSTITUTIONAL MEMBERSHIP
Graph – Analysis & Evaluation
Line graph
1. Describe this graph (analysis) and then suggest the reasons for these trends (evaluation)
Bar Chart
2.Describe this chart (analysis) and then suggest the reasons for these trends (evaluation)

Describe these graphs / charts (analysis) and then suggest the reasons for these trends (evaluation)
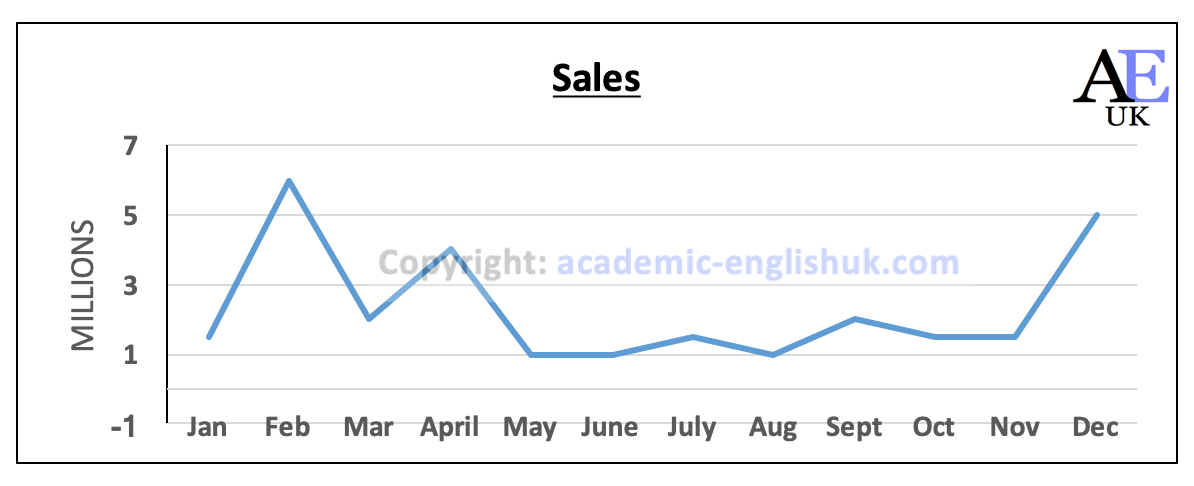
1. Analysis: Peaks in Feb, April, Dec.
2. Evaluation: Product is flowers (Feb=Valentine’s day / April = Easter / Dec = Christmas).
Other answers are possible with justification.
1. Analysis: Peak sales in June, July, August
2. Evaluation: Ice cream sales
Other answers are possible with justification.
Useful graph language: Description
The graph from (source) presents data on (title)…
The graph from (source) shows/ illustrates (title)…
If we look at this graph on (title) from (source) you can see…
The y axis (vertical) is… and the x axis (horizontal) is…
(Graph) These lines represent… (Bar) These Columns are… (Pie) These segments are… (Table)
These rows are…
Useful graph language: analysis
What you can see is… / From the graph we can see…
I’d like to focus your attention on…
If you look at this…, you’ll see / notice / understand
A key significant area is … / Two key significant areas are…
An important point is… / Two important points I’d like to illustrate are…
What is interesting here is…
An interesting observation is…
An analysis of the graph illustrates…
Looking at ….
Useful graph language: evaluation
This seems to suggest that…
This is possibly because of…
This is (clearly) due to…
One reason for this could be…
An evaluation of this data suggests / provides evidence for / highlights…
To provide evidence to my previous point the graph highlights…
Overall, this highlights the significance of…
Therefore, this provides evidence that…
Describing graphs: using analysis and evaluation
Describing graphs: using analysis and evaluation
The graph from (source) shows/ illustrates (title)…
The y-axis is… and the x-axis is…
Overall, GDP has remained… between…
I’d like to focus your attention on two key significant areas.
(Analysis) The first one is ………. (explain data)
(Evaluation) This is/was possibly because of ….
(Analysis) The second one is ……. (explain data)
(Evaluation) This is / was clearly due to …………
Overall, this graph highlights the evidence that…
A future prediction is that……
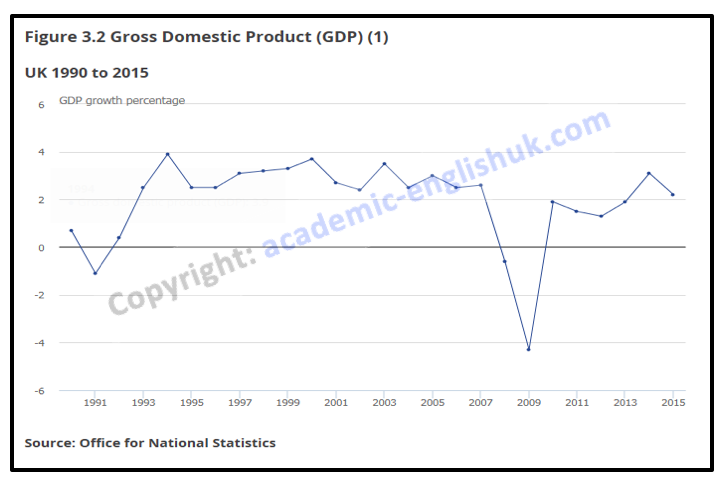
The graph from The Office of National Statistics (2015) shows GDP growth in the UK over the years 1990 to 2015.
The y axis is the percentage of growth while the x axis is the individual 15 years.
Analysis: Overall, GDP has remained reasonably stable from 1993 to 2007 and again in 2013 to 2015 within the 2-4% range.
I’d like to focus your attention on two key significant areas.
Analysis: The first one is in 1991, where as you can see GDP fell to -1 and then dramatically soared to 4% within two years.
Evaluation: This was possibly because of the UK suffering a small recession caused from high interest rates and limited availability of credit. The government lowered the interest rates shortly after this and this would explain the sudden rise in 1992.
Analysis: The second interesting point is the sudden drop in GDP in 2007 ……. (answers in paid version).
Evaluation: This is clearly due to the 2007/8 global financial crash, where the many countries suffered what is now being called …… (answers in paid version).
Evaluation: Overall, this graph highlights the evidence that global markets and recession ….(answers in paid version).
Prediction: There is a possibility that with such uncertainty in the world financial markets that ….. (answers in paid version).
Paid version: here
Describing graphs:
Task: Analyse and evaluate an Office of National Statistics (ONS) graph / chart / table and give a 1-2-minute presentation on your findings.
Guidelines
-
Your teacher will allocate one of the graphs / charts / tables below.
-
Open the specific ONS webpage link and find the specific section and graph / chart / table.
-
Analyse and evaluate the graph / chart / table using language sheet 1.
-
You must follow the 3 key stages (describe the key elements (labelling), analysis and evaluation).
-
You may need to do some internet research to help your understanding / evaluation.
-
Give a 2-minute presentation of your graph using your own analysis and evaluation.
-
You have 20-minutes preparation time.


18 more different graphs / charts / tables with paid version.
Other topics: life satisfaction / divorce / religion / mental health / alcohol / mobile phones / murder / technology / leisure / population growth / life expectancy / etc..
Describing graphs: analysis and evaluation (updated 2023)
This lesson begins with describing basic graphs and suggesting what they could represent. It then provides the language necessary for describing, analysing and evaluating. This is followed by students researching and analysing graphs/charts/tables from the Office of National Statistics (ONS) and giving a short presentation on their findings. Example. Level: ***** [B1/B2/C1] TEACHER MEMBERSHIP / INSTITUTIONAL MEMBERSHIP
 Describing Results (questionnaire data) [new 2023]
This lesson teaches students how to describe the results from a questionnaire. It provides language for describing quantities, group sizes, specific features and reporting verbs. It includes model answers and a range of practice activities. Example Level: ***** [B1/B2/C1] TEACHER MEMBERSHIP / INSTITUTIONAL MEMBERSHIP
Academic description, analysis & evaluation
This lesson helps to improve students’ awareness and understanding of the difference between description, analysis and evaluation. It includes paragraph analysis, a detailed language review reference sheet and graph and sentence level quotation analysis. Example. Time: 120mins. Level ***** [[B2/C1] TEACHER MEMBERSHIP / INSTITUTIONAL MEMBERSHIP